Description of the system architecture using the C4 model

To begin with, let's deal with the terminology of the C4 model - 4 diagrams Context diagrams (level 1), Container diagrams (level 2), Component diagrams (level 3), Code diagrams (level 4). The C4 model is one approach to describing the architecture of a system. In addition, there are others, such as n + 1 view and others.
Why you need to describe the architecture using the C4 model and other diagrams
To help teams describe the architecture both when designing a system and when documenting an already completed system "As is"
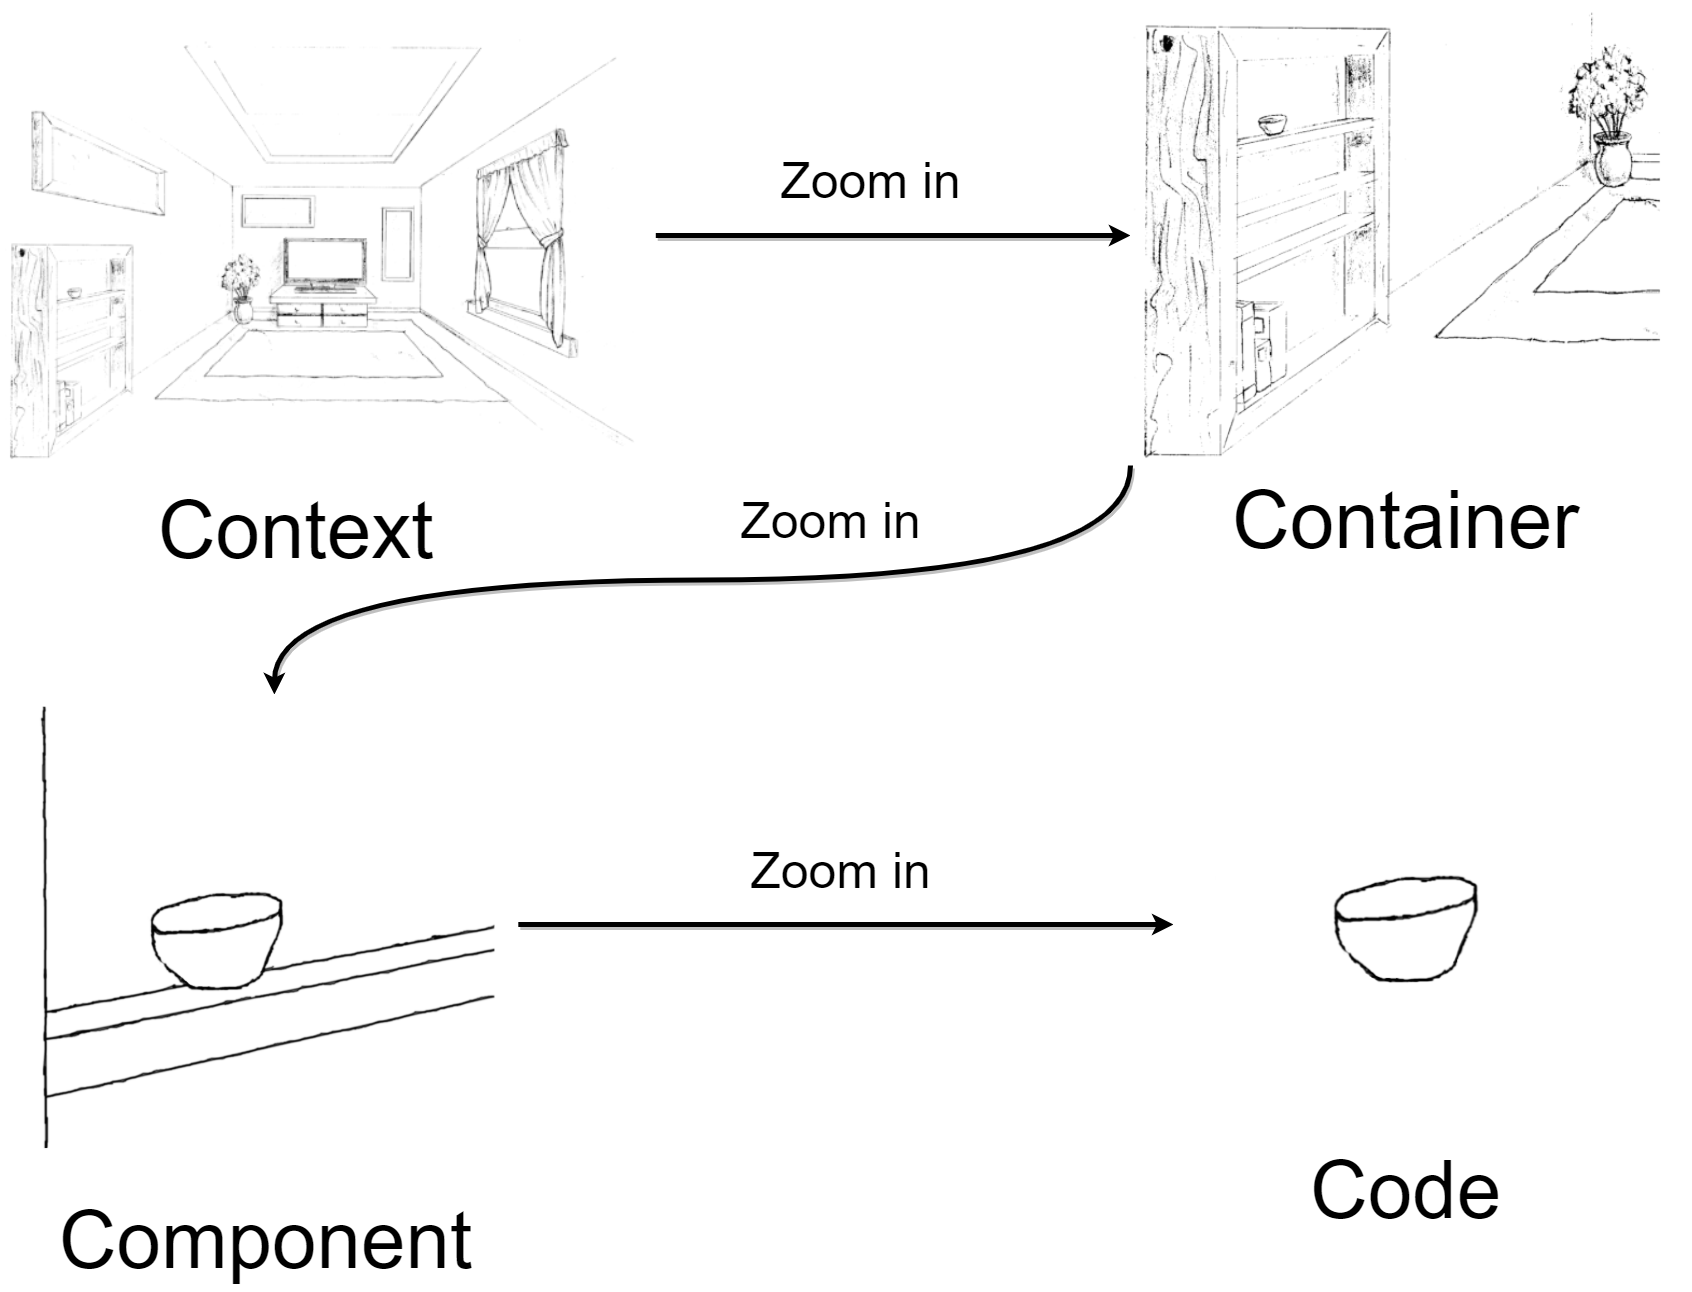
Zoom in on desired areas. Below we will consider an example with a zoom using an example with a room
To give architects, developers, PMs, and analysts abstract models to work with architectural diagrams.
Diagrams should be equally understandable to both developers and business stakeholders. Otherwise, how then the developers will build the system, and the stakeholders will validate the "correctness" of the proposed solutions.
Architectural Diagram Design Tools
To draw diagrams, you can use, in principle, any convenient tool, from the most popular:
C4 model charts
The different levels in C4 allow architects to talk about the product at different levels, to different audiences:
Context diagrams (level 1)
The context diagram is the first thing you create when working with the system. If you don't add this diagram and describe the contexts, it could cost you missed integrations and system design errors. The context may include some lower-level details, which is fine.
Context diagrams show a system in terms of how it interacts with users and other systems. By analogy with the room, this is a top-level room, showing which “Item Neighbors” the Plate is next to.
If we talk about a real example, let's look at a simple system that allows a user to log in / register and send him an email to confirm the password, an example of how this might look below.
Context Diagram Example
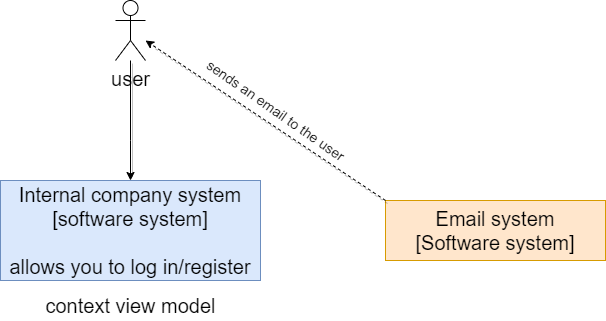
In other words, the context diagram is the 'big picture of our system.
The questions that a context diagram answers are:
- What system are we building?
- Who is using it?
- How does it fit into the existing environment?
What to Consider
- Define system users.
- Identify external systems that interact with the system
- Create a single rectangle representing your system.
- Add links between the system, users, and external systems.
- Write meaningful comments for each component.
Container diagrams (level 2)
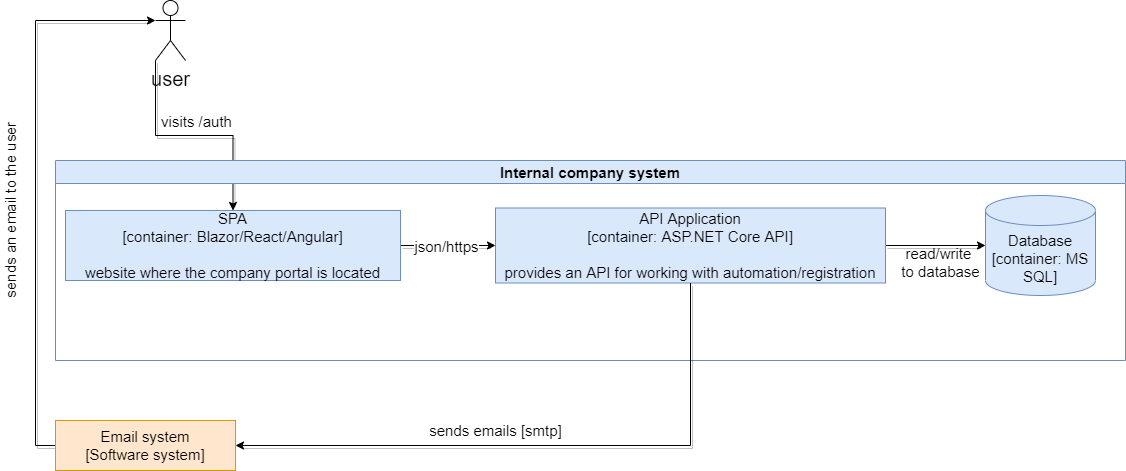
In this diagram, we "zoom" closer to the room to see what is in the box Internal company system
Each container is a separately deployable object or runtime that often runs in its own process space. Because of this, communication between containers usually takes the form of inter-process communication.
Such a diagram is useful for both the development team and the people who support the project.
Container diagram example:
The questions that the container diagram answers are:
- What is the general view of the software environment?
- What are high-level technological solutions?
- How are functional blocks highlighted in the system (if we display them here)?
- How do containers interact with each other?
What to Consider
- Define a list of entities: microservices, repositories, external services.
- Add comments about the purpose of each component and the technology it implements.
- Add connections with arrows.
- Add meaningful labels to each arrow.
- Choose the color of the scheme.
- Create a legend with explanations.
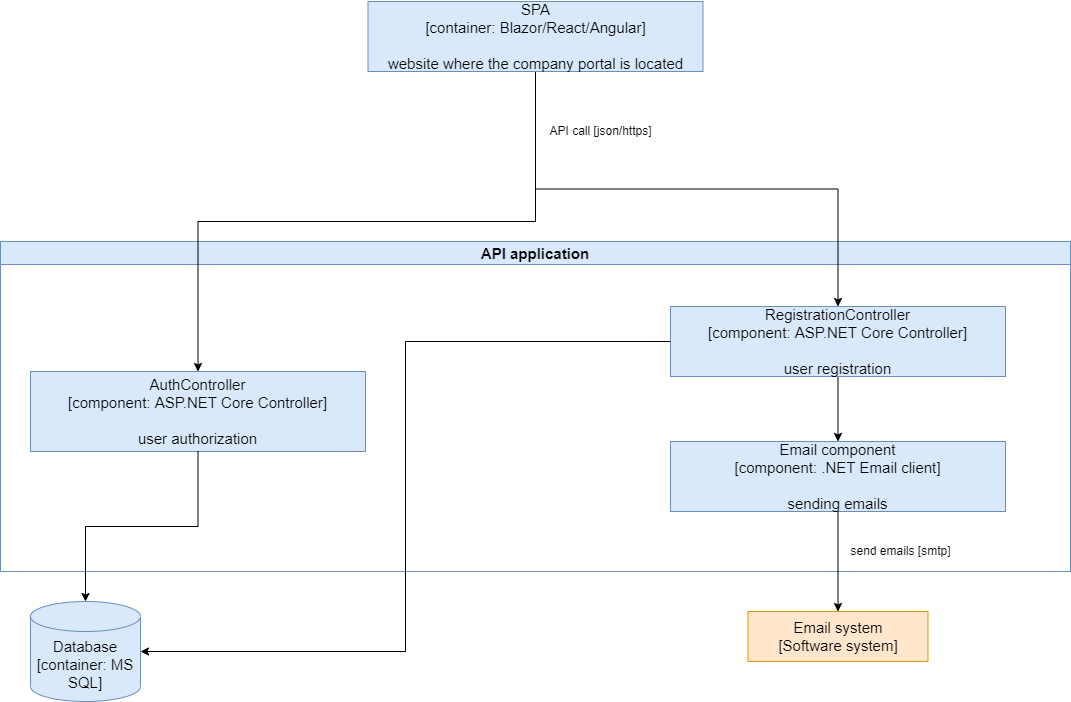
Component diagrams (level 3)
In this diagram, we zoom in on the Closet to describe the internal system in more detail at the level of components and controllers. In the case of a real example, we zoom "API Application"
In this context, a component is a group of related functions brought together by a well-defined interface. In C# or Python, Java, for example, this is the set of implementation classes behind the interface. All components are not individually deployable units and typically run inside a container in the same process space.
Component Diagram Example:
The questions that the component diagram answers are:
- What components do the system and functional blocks consist of?
- Is there an understanding of how the system works at the top level (high-level design) in the context of directories, documents, registers
- Are all components tied to containers?
What to Consider
- Determine the main components of the subsystem you are drawing
- Define relationships between these components and external components such as data stores, 3rd party services
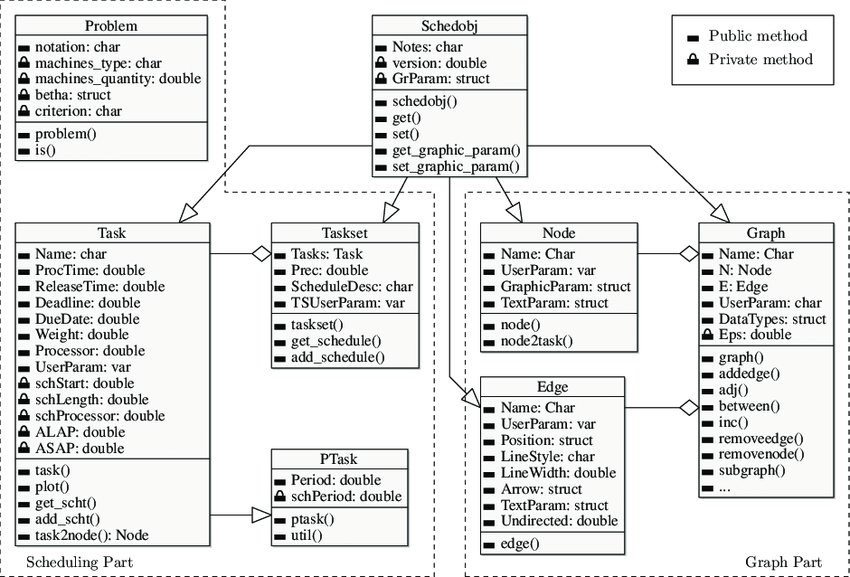
Code diagrams (level 4).
This diagram will be useful directly to developers who will implement the modules of the system. Essentially, a code diagram is a UML class diagram. During development, they will become obsolete before you have time to finish them, so I recommend using them only when preparing for system development (for development time estimates, etc.) or automatically generating them from ready-made code.
An example of what a code diagram might look like:
Additional charts
Not all necessary information about the system is covered by C4. For this, several more important diagrams should be considered when designing a system:
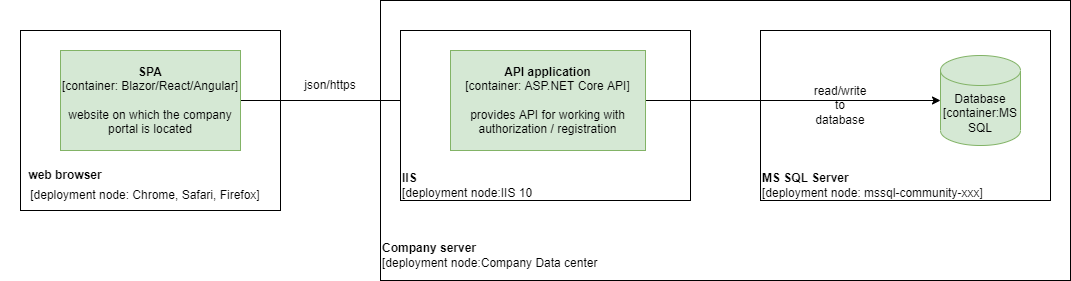
Deployment diagram
With the help of context diagrams, containers, and sequence diagrams, you can understand what parts the system consists of, how they are connected and interact with each other. But they are unlikely to answer the questions of accessibility, scalability, and security. A deployment diagram will help with this.
What to Consider
- Computing resources. These can be virtual machines, dockers, Kubernetes clusters, and cloud functions. Mobile devices and desktop computers can also be considered computing resources.
- Repositories. Persistent data stores such as relational and NoSQL databases, binary file stores such as images, music, and videos, big data stores, and so on.
- Messaging resources. Installations of Kafka / RabbitMQ, Google Cloud pub/sub, AWS SQS, and others.
- Networks. Your computers use networks to communicate with each other. Both physical and virtual networks should be displayed.
- Accessibility zones. You can think of them as data centers.
- infrastructure nodes. DNS servers, load balancers, firewalls, CDNs
Deployment diagram example:
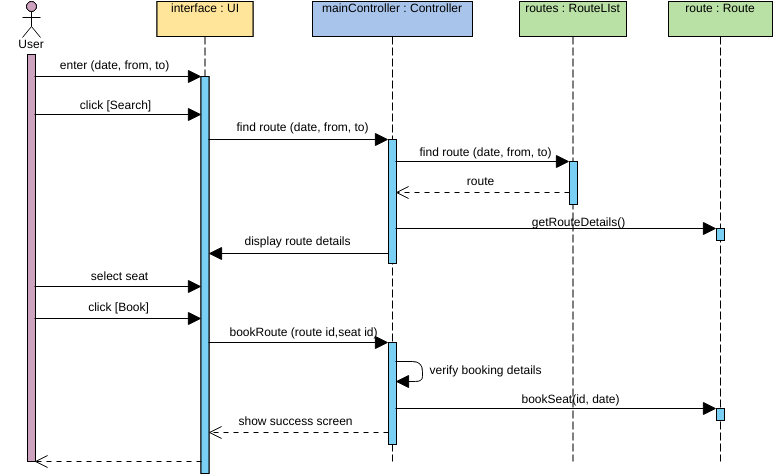
Sequence Diagram
A sequence diagram is needed to document a project in terms of use cases. It displays the life cycle of the object and the process of executing functions
The questions that a sequence diagram answers are:
- What do Actions work?
- How do components interact with each other?
- Request lifecycle?
What to Consider
- Select a function (login, purchase, etc.).
- Determine the entities (components) involved in this process.
- Put them on the chart.
- Add interaction (arrows).
Example Sequence Diagram